
High-frequency Ultrasound Imaging for Cardiac Fibers
3D Ultrasound and MR Diffusion Tensor Imaging
Simulated Ultrasound Image from MR Diffusion Tensor Image
Cardiac Fibers in Pig Hearts
Cardiac muscle fibers directly affect the mechanical, physiological and pathological properties of the heart. Patient-specific quantification of cardiac fiber orientations is an important but difficult problem in cardiac imaging research. We proposed a cardiac fiber orientation estimation method based on three-dimensional (3D) ultrasound images and a cardiac fiber template that was obtained from magnetic resonance diffusion tensor imaging (DTI). A DTI template based framework was developed to estimate cardiac fiber orientations from 3D ultrasound images using an animal model. It estimated the cardiac fiber orientations of the target heart by deforming the fiber orientations of the template heart, based on the deformation field of the registration between the ultrasound geometry of the target heart and the MRI geometry of the template heart. In the experiments, the animal hearts were imaged by high-frequency ultrasound, T1-weighted MRI, and high-resolution DTI. Our proposed method was evaluated by four different parameters: Dice similarity coefficient (DSC), target errors, acute angle error (AAE), and inclination angle error (IAE). Its ability of estimating cardiac fiber orientations was firstly validated by a public database. Then, the performance of the proposed method on 3D ultrasound data was evaluated by an acquired database. The feasibility of this framework was also performed on 3D ultrasound images of a beating heart. Our proposed framework and its further improvements could contribute to understanding the dynamic mechanism of the beating heart and has the potential to help diagnosis and therapy of heart disease.
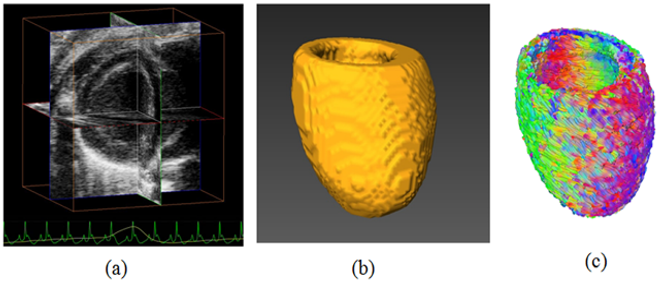
3D ultrasound imaging, geometric reconstruction, and the estimated cardiac fiber orientations of an in vivo beating rat heart. (a) 3D ultrasound volume in vivo. (b) Reconstructed cardiac geometry. (c) Estimated cardiac fiber orientations from the geometry.
Data Processing
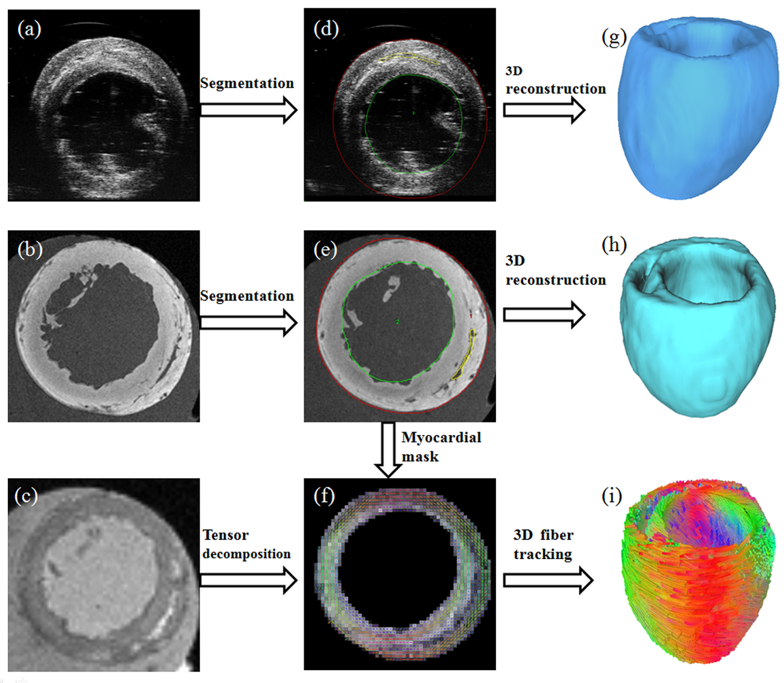
Processing of cardiac imaging data. (a ) 3D ultrasound image. (b) T1-weighted MR image. (c) DTI data. (d-e) geometric segmentation results. (f) tensor decomposition of DTI data based on the segmentation mask from T1-weighted MRI. (g-h) reconstructed 3D geometric volumes. (i) tracked 3D cardiac fibers.
Rat Heart Fiber Estimates
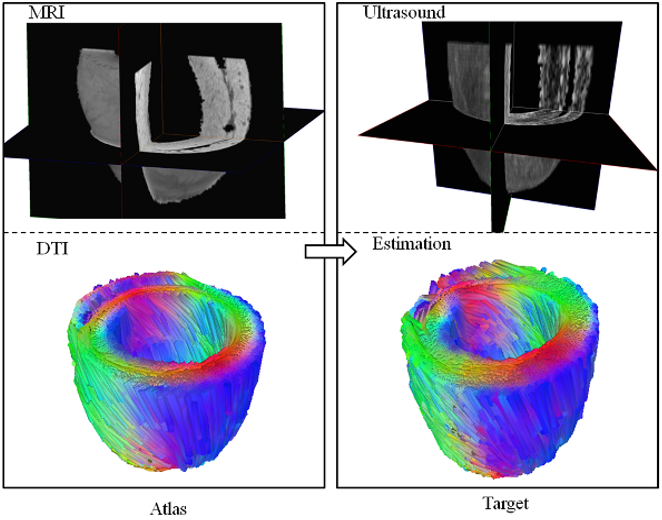
Results of the cardiac fiber orientations estimated from 3D ultrasound of a rat heart, based on the template of MRI and DTI. Left column is the MRI geometry and DTI fiber orientations of the template heart; right column is the ultrasound geometry and the estimated cardiac fiber orientations of the target heart.
Canine Heart Fiber Estimates
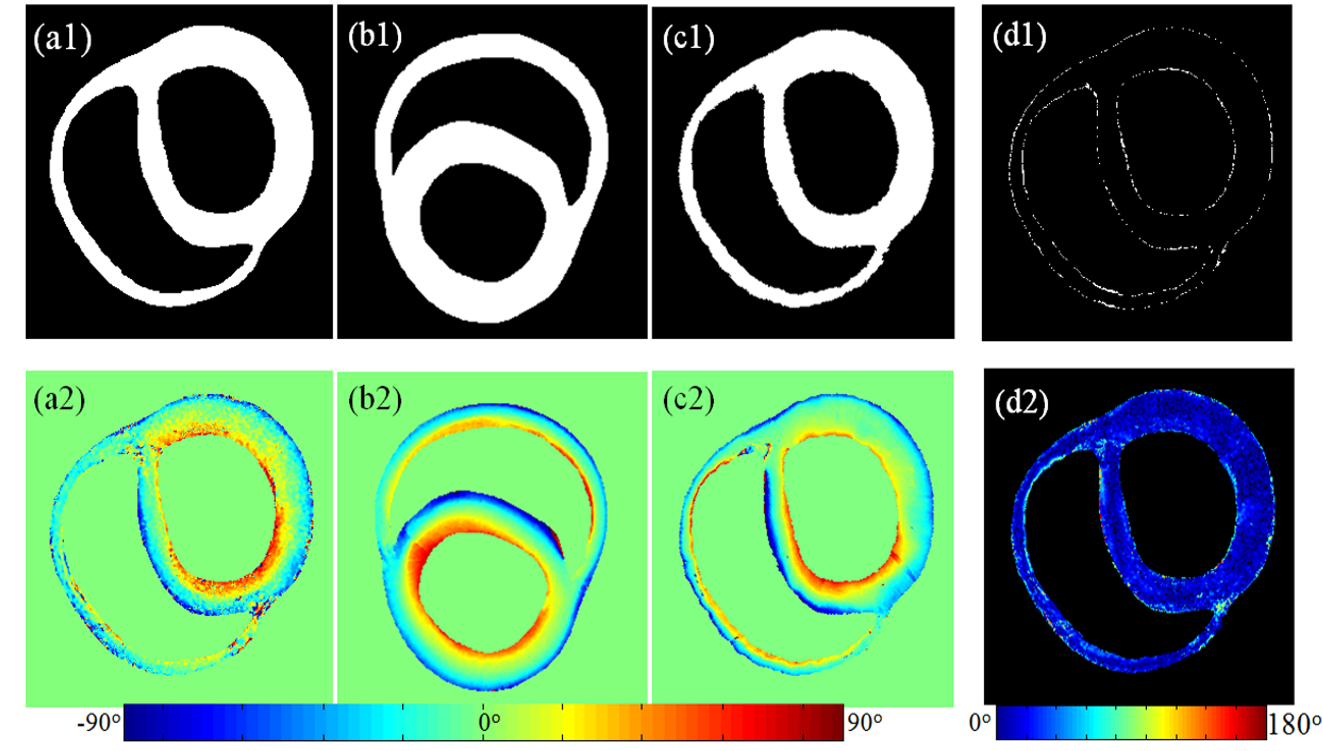
Results of both geometry and fiber orientation deformation of one slice from the canine heart data, including their estimation errors. Upper row is the geometric results and the lower row is the fiber orientation results. (a1-a2) Geometry and inclination angles of the target heart. (b1-b2) Geometry and inclination angles of the template heart. (c1-c2) Estimated geometry and inclination angles of the target heart. (d1-d2) Corresponding errors between the target and its estimation.
Evaluation Methods

Evaluation methods for validating the accuracy of both geometry and fiber orientation deformation. (a) 3D geometric overlap ratio between the target (red) and template (yellow) hearts, calculated as DSC. (b) Distance between the corresponding papillary muscle centers of the template (red dot) and target (blue dot) hearts, calculated as the target registration error (the distance of the white double-head arrow in the amplified image). (c) Acute angle α between both imaged and estimated fiber directions. (d) Angle θ between the tangential directions of the epicardial contour in the short axis plain and the fiber direction projected in the epicardial tangential surface, as calculated as the inclination angle.
Histology
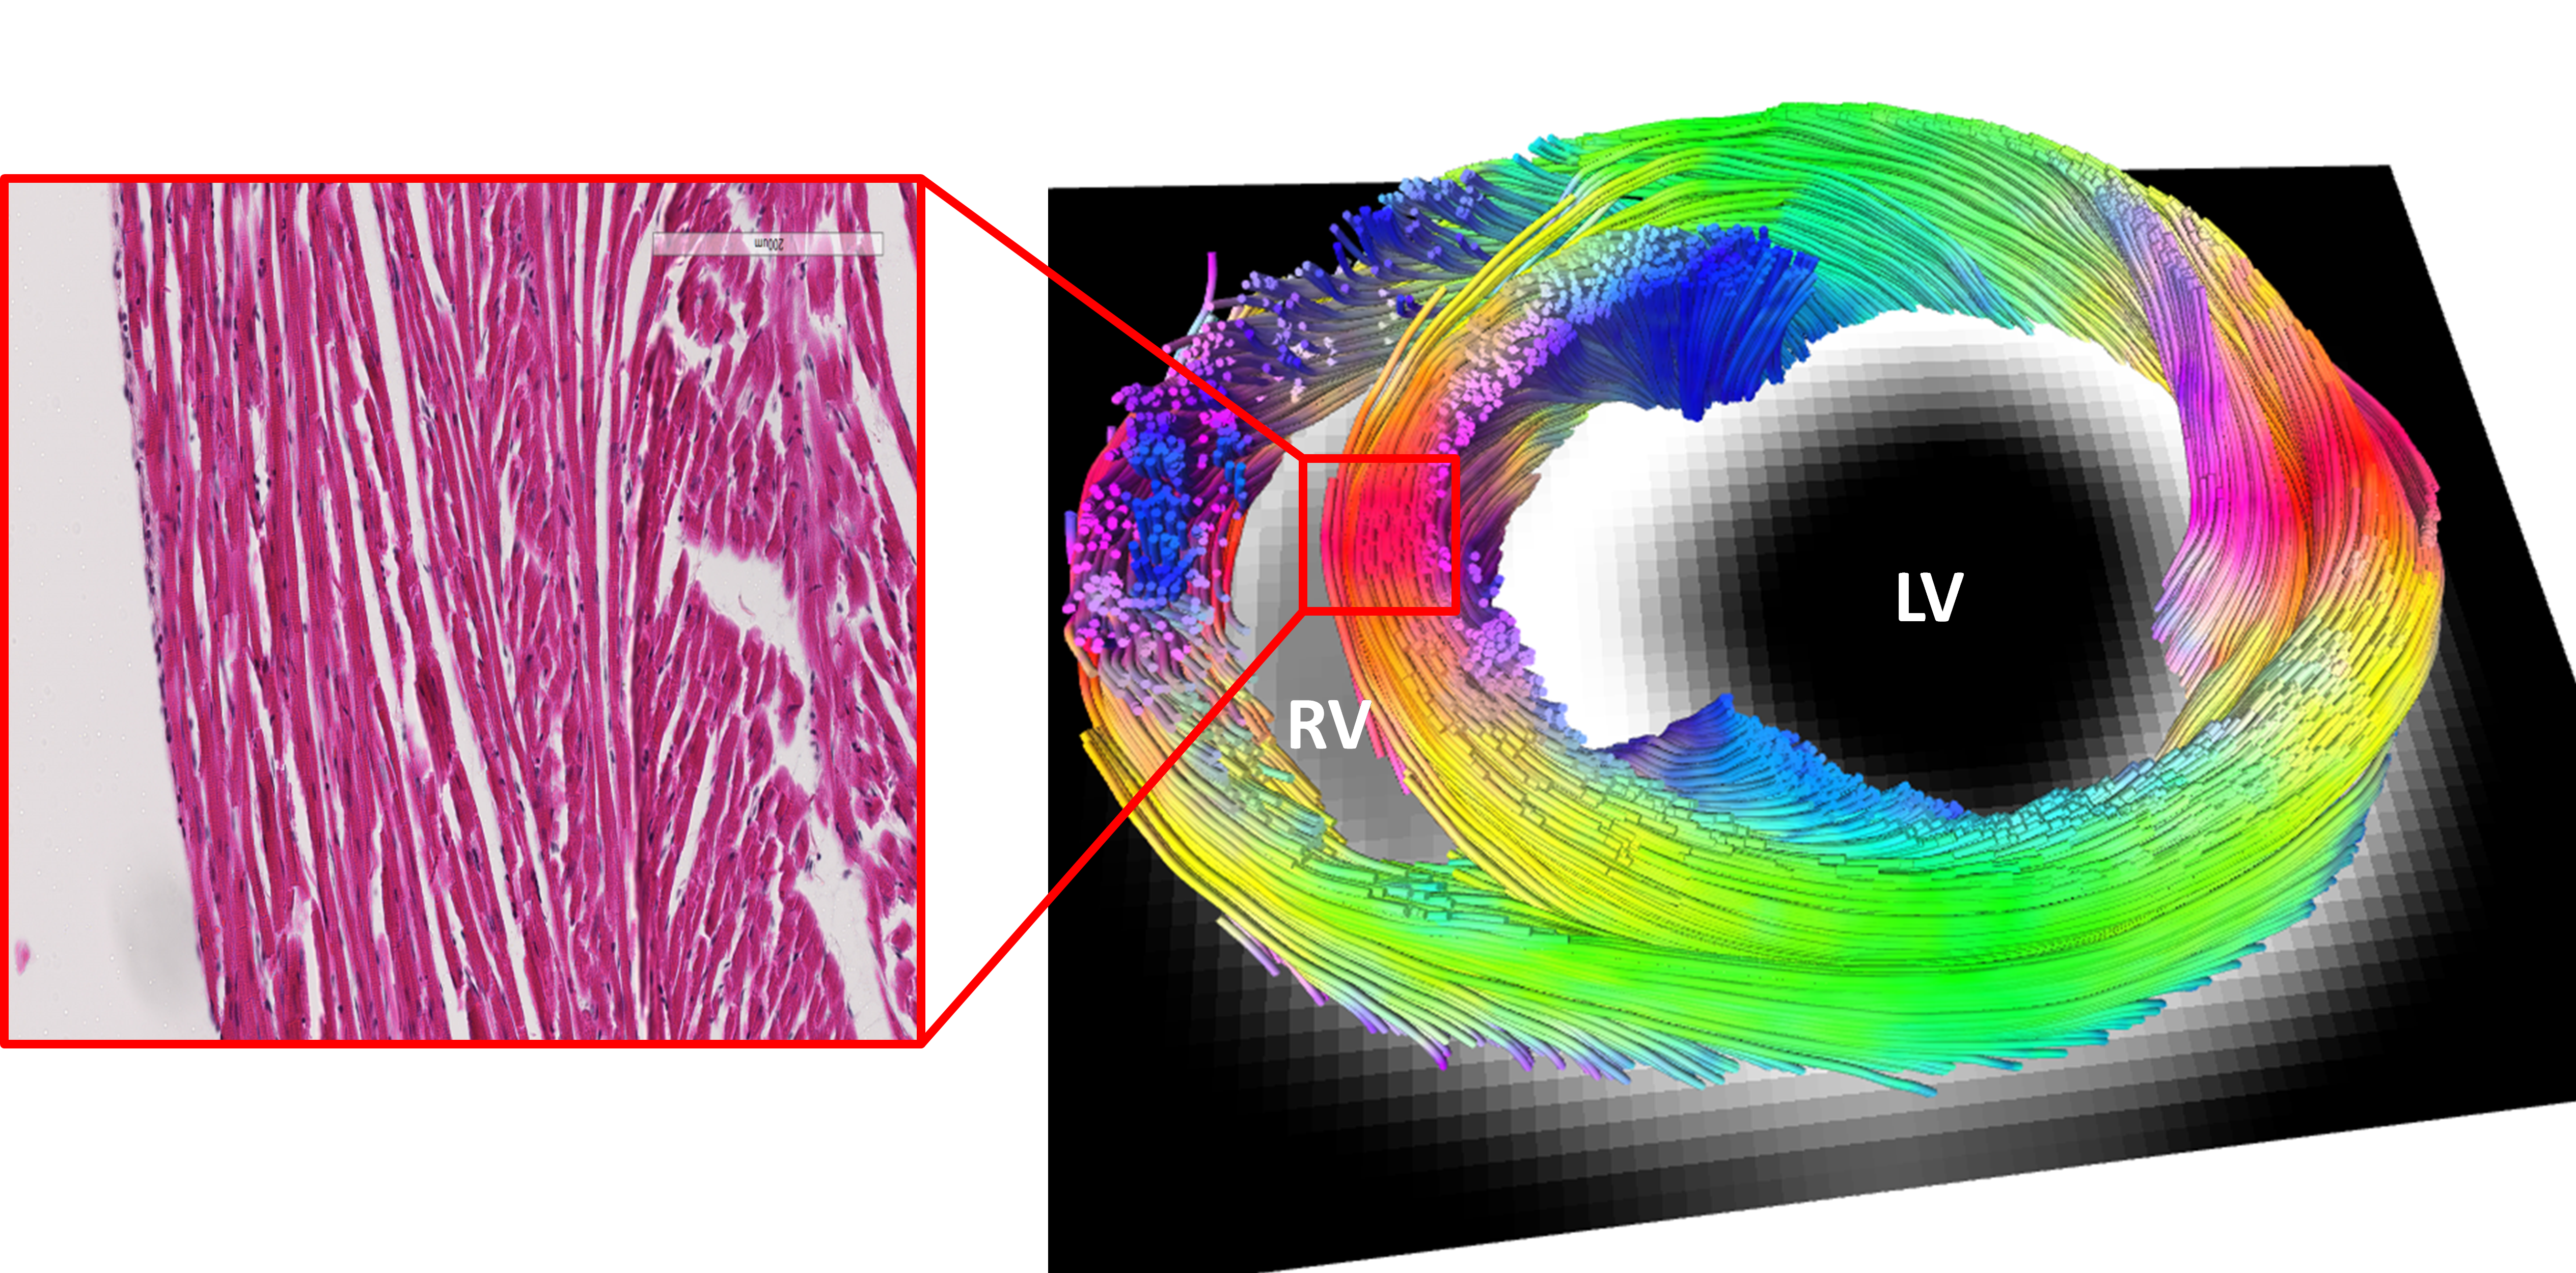
Cardiac fiber histology (left) and fiber orientation estimation (right) for a rat heart. In the normal heart, the cardiac fiber orientations are changed from epicardium with left-handed helical angles to endocardium with right-handed helical angles. These fiber orientations are smoothly changed along with myocardial wall. In the diseased heart, although the cardiac fiber orientations keep the similar trends that epicardium is left-handed and endocardium is right-handed, the variations of helical angles along with the myocardial wall become smaller because of the large deformed right ventricle geometry. On the fiber images (right), pure green color means fiber direction in x-axis, pure red color means fiber direction in y-axis, pure blue color means fiber direction in z-axis, and other colors are mixed with the three colors, according to their components in three directions.