
High-frequency Ultrasound Imaging for Cardiac Fibers
3D Ultrasound and MR Diffusion Tensor Imaging
Simulated Ultrasound Image from MR Diffusion Tensor Image
Cardiac Fibers in Pig Hearts
High-frequency ultrasound (HFU) has the ability to image cardiac muscles. The quantitative assessment of these myofiber orientations has a number of applications in both research and clinical examinations; however, difficulties arise due to the severe speckle noise contained in the HFU images. Thus, for the purpose of automatically measuring myofiber orientations from two-dimensional HFU images, we propose a two-step multiscale image decomposition method. It combines a nonlinear anisotropic diffusion filter (NLADF) and a coherence enhancing diffusion filter (CEDF) to extract myofibers. This method has been verified by ultrasound data from simulated phantoms, excised fiber phantoms, specimens of porcine hearts, and human skeletal muscles in vivo. The quantitative evaluations of both phantoms indicated that the myofiber measurements of our proposed method were more accurate than other methods. The myofiber orientations extracted from different layers of the porcine hearts matched the prediction of an established cardiac mode and demonstrated the feasibility of extracting cardiac myofiber orientations from HFU images ex vivo. Moreover, HFU also demonstrated the ability to measure myofiber orientations in vivo.
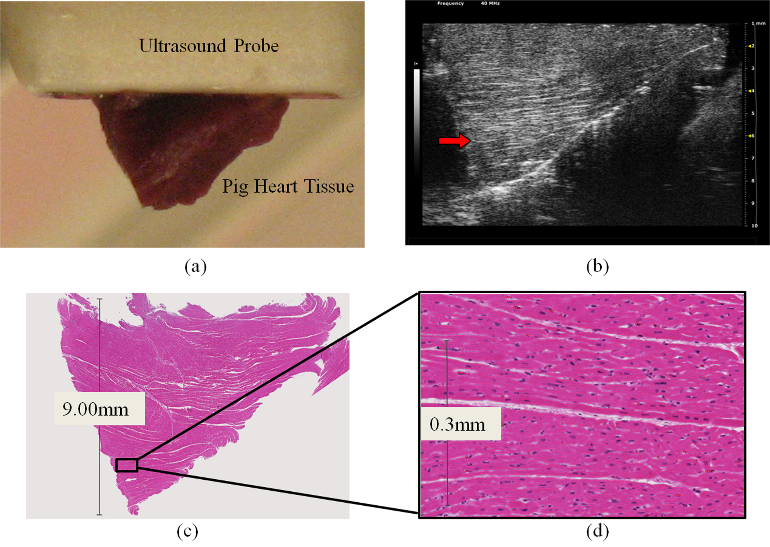
Comparison between high-frequency ultrasound image and the stained histology slide. (a) The specifically shaped tissue from the left ventricle wall of a porcine heart during ultrasound imaging. (b) The corresponding ultrasound image. (c) The corresponding histological slide. (d) The enlargement of one small region from the histological slide.
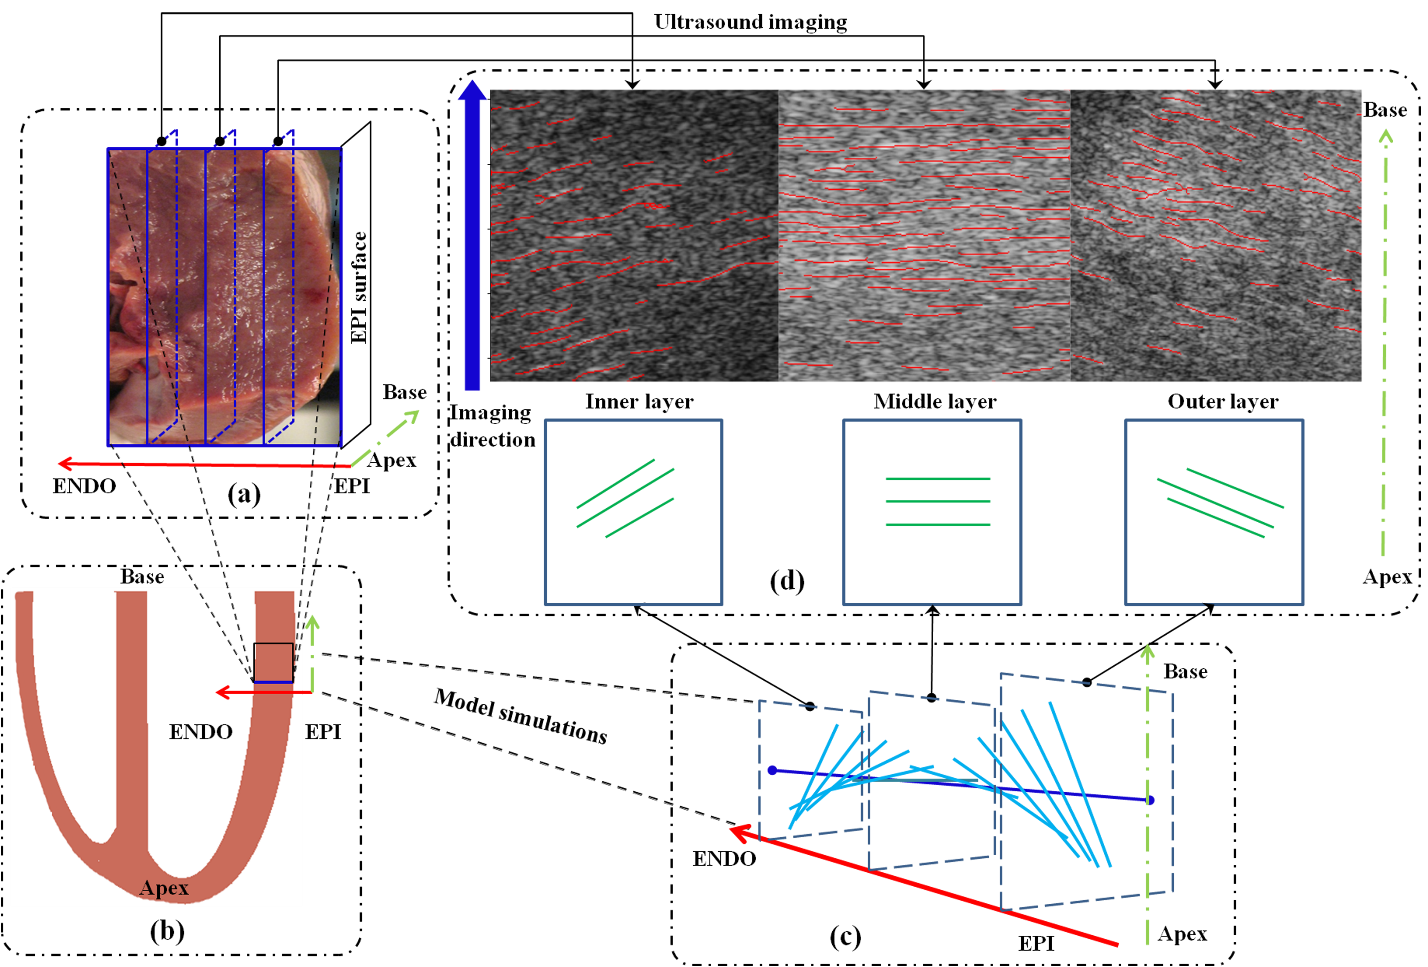
A comparison of different layer orientations between high-frequency ultrasound results and model simulations (Savadjiev et al., 2012). (a) Picture of the excised specimen from left ventricular free wall, which was imaged by ultrasound three times. (b) Diagram of the heart ventricles: left ventricle (LV) and right ventricle (RV) and the specimen in (a) was excised from LV free wall. (c) Myofiber orientations of the excised specimen from epicardium (EPI) to endocardium (ENDO) based on model simulations. (d) Similarities between the different layer orientations of the excised specimen extracted from ultrasound images by our proposed method and the ones from model simulations. The red arrow lines indicate the direction from EPI to ENDO of the free wall, the green arrow lines indicate the ultrasound imaging direction from apex to base of the heart, and three blue rectangles indicate the three different ultrasound imaging planes.
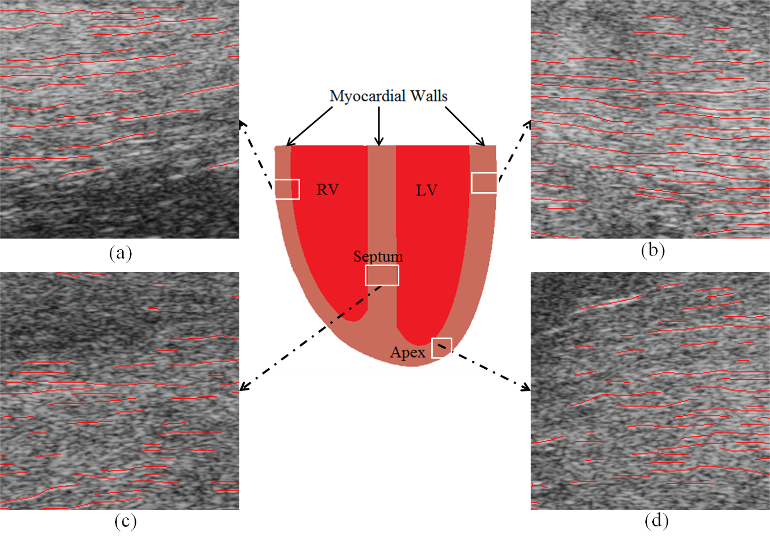
Cardiac myofiber orientations extracted by the proposed method from the high-frequency ultrasound images of four different specimens of different ventricle regions. (a) Free wall of right ventricle. (b) Free wall of left ventricle. (c) Ventricle septum wall. (d) Apex.